I’m no Database Administrator and learning about SQL every day, but I came across a nice download from the Microsoft website. It’s called Microsoft® SQL Server® 2012 Performance Dashboard Reports. It sounded like something I might use form time to time. You can download the Performance Dashboard Reports here: http://www.microsoft.com/en-us/download/details.aspx?id=29063
The installation is pretty simple, just download the msi file and run it on your SQL server! 🙂
When the installation is finished just follow the instructions as pointed out via the readme file:
Getting Started With the Performance Dashboard Reports
1. Each SQL Server instance you plan to monitor must contain the procedures and functions used by the queries in the reports. Using SQL Server Management Studio (SSMS), open the setup.sql script from your installation directory (default of %ProgramFiles(x86)%\Microsoft SQL Server\110\Tools\Performance Dashboard) and run the script. Close the query window once it completes.
2. In the Object Explorer pane in SSMS, right mouse click on the SQL Server instance node, then choose Reports-Custom Reports. Browse to the installation directory and open the performance_dashboard_main.rdl file. Explore the health of your server by clicking on the various charts and hyperlinks in the report.
All of the remaining reports are accessed as drill through operations from the main page or one of its children. For a detailed explanation of all installation requirements and guidance on how to use the reports, please see the help file, PerformanceDashboardHelp.chm.
When opening the custum report, it looks like this:
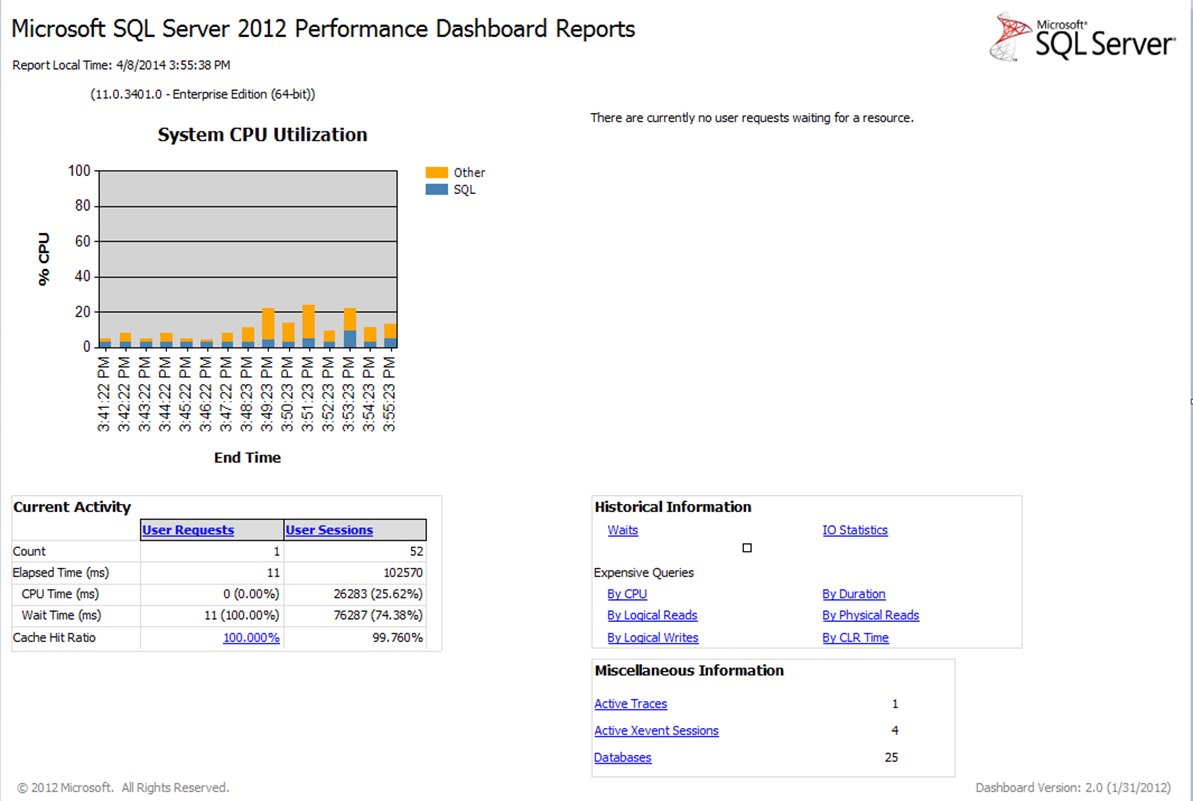
This is a test machine so there is not much to do, but you’ll get the idea.
You can drill down in the report, as shown in the pictures below:
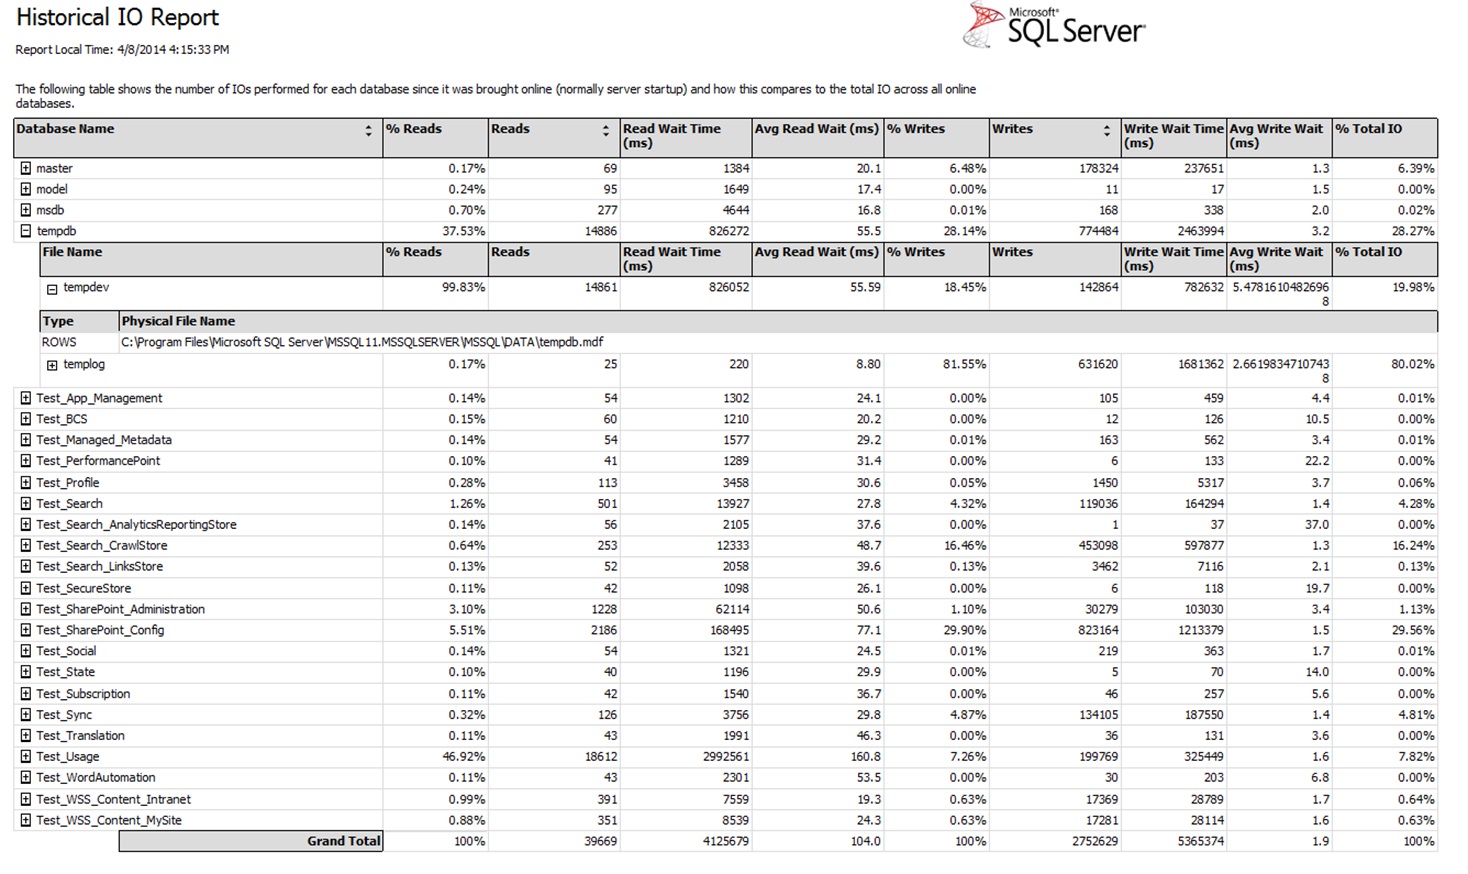
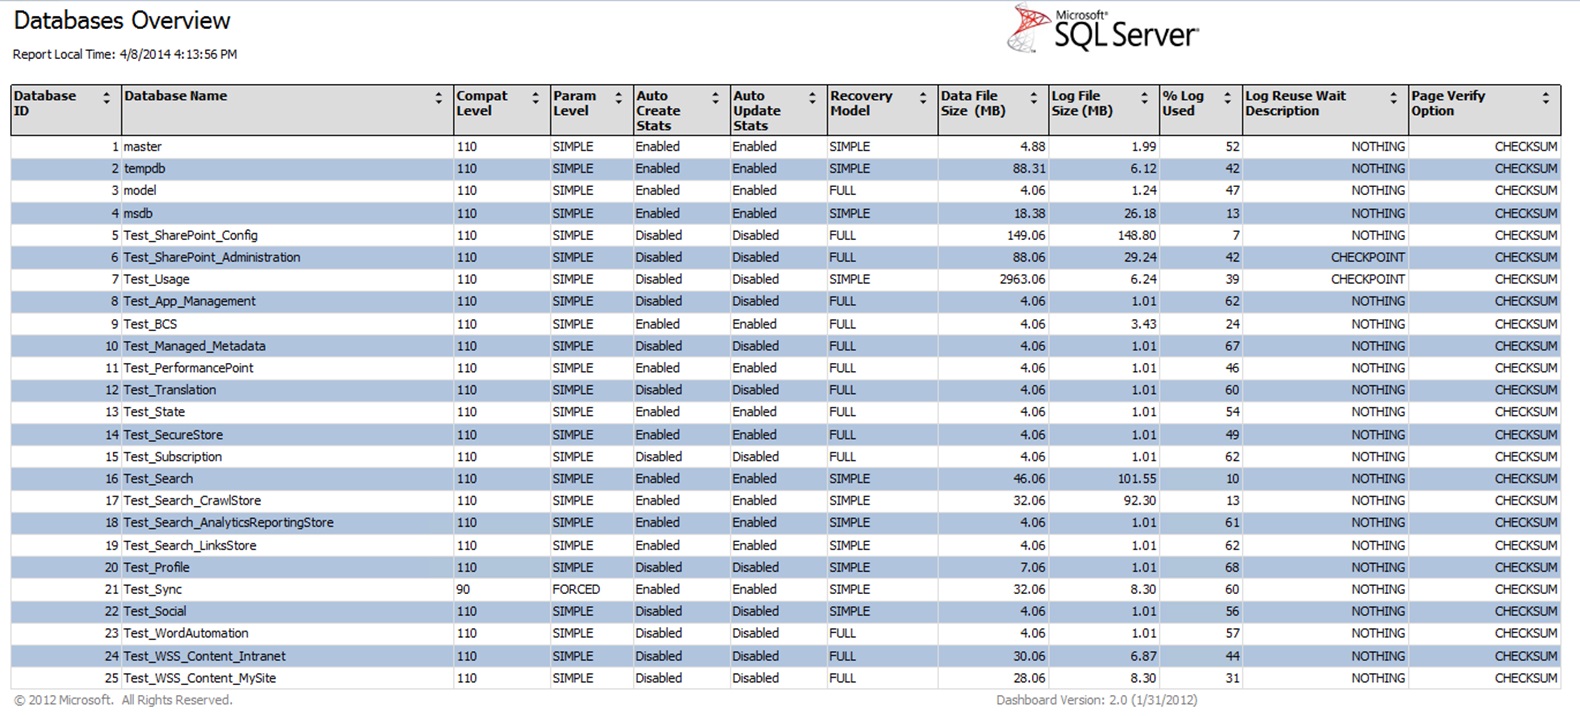
I know that this is not a complete picture when you want an overview of the performance of SQL server but it’s a start.


Leave a Reply